Storrito is your autopilot forInstagram Stories
Part 1: How to Measure the Success of Your Instagram Stories (Beyond the Basics)

In part 1 of this blog series, we’re reviewing how best to use Instagram Story metrics to convert views into results.
Instagram Stories can become your most valuable sales funnel. But only if you’re measuring the right things. In this article, we’re going to take the example of a wellness or hygiene brand and use it to demonstrate how best to make the most of metrics in order to grow your brand.
Most brands stop at views or swipe-ups. That’s a mistake.
Here’s how to measure what matters, and why tracking Stories should start with intent, not vanity metrics.
Understand What 'Success' Actually Looks Like
Before you get buried in insights, pause and ask:
What’s the goal of your Stories right now?
Are you:
- Educating a new audience?
- Building trust to drive first-time purchases?
- Deepening emotional connection for repeat sales?
Your KPI focus should change depending on intent. Here's a quick guide:
| Goal | Primary Metrics to Track |
|---|---|
| Awareness | Reach, Impressions, Follower Growth |
| Engagement & Trust | Taps Back, Replies, Poll Interactions |
| Clicks & Traffic | Link Clicks, CTR (Link Clicks ÷ Reach), Time on Site |
| Conversions | Sales from IG Story traffic, Signups, Retargeting Success |
The KPI Dashboard for Instagram Story Performance
Here’s a streamlined way to build your own weekly or monthly Instagram Story review sheet:
| Metric | Why It Matters | Target Benchmark |
|---|---|---|
| Story Reach | Measures unique accounts reached per Story | Growth over time |
| Impressions | Includes repeat views - shows interest | Depends on audience size |
| Taps Forward / Back | Forward = skimmed; Back = rewatched → deeper interest | The more 'Back', the better |
| Story Exits | Shows the drop-off point in your narrative | Keep this under 15-20% |
| Link Clicks (Sticker) | Direct traffic signal for product or CTA | Primary conversion metric |
| CTR per Story | Clicks ÷ Reach (signals relevance of message) | Aim for 1-3%+ |
| Website Sessions from IG | Shows real traffic (use UTM links!) | Google Analytics |
| Time on Site from IG Traffic | Shows quality of click - did they browse or bounce? | 1:30+ would be strong here |
| Conversion Rate (IG Traffic) | Tells you if your traffic is actually buying | 0.5-2%+ is realistic |
| Replies, Polls, DMs | Emotional engagement; community-building metric | Track per campaign |
Don’t Just Track: Analyze Funnels
Here’s an example funnel metric path for a product-based Story campaign:
- Reach → 7,200
- CTR (Link Clicks ÷ Reach) → 3.2%
- Site Sessions from Story → 230
- Conversion Rate from those sessions → 1.3%
- Revenue → $1,200
This gives you a full feedback loop from Story to sale and helps you identify where to improve. Low CTR? Your Story might need a stronger hook or clearer CTA. Lots of traffic, but no conversions? Maybe the landing page doesn’t match the tone of the Story. As you can see here, having a consistent brand identity and, above all, consistent story-telling elements can make all the difference.
Context Matters: Nuanced Metrics
Let’s refer back to our example brand. Customers - especially those going through big life shifts like childbirth or menopause - aren’t on social media just to buy creams or supplements. They’re looking for support, answers, and emotional safety.
That means metrics like DM replies, poll votes, Q&A submissions, and highlight views are just as important as clicks.
These 'soft signals' tell you if your messaging is building trust, not just selling a product. In your KPI dashboard, give these metrics a column of their own. Tweak them based on what you know about your audience. Ask yourself: What does it look like when my messaging resonates?
If you're unsure how to define these softer success indicators, study how other values-driven brands show impact through community response. Take note of how they frame trust and emotional connection, then return to your own brand with fresh eyes - and a sharper sense of what your audience needs to feel seen.
Next Up
In Part 2, I’ll break down ready-to-use Instagram Story Funnels that convert passive views into clicks and even sales, without ever feeling too sales-y. These templates are built for wellness brands and come with real example scripts.
Ready to move beyond likes and start building a responsive story strategy? Stay tuned for the next post!

Lydia
Lydia
Ready to schedule your stories?
Tools
- Auto Post Instagram Stories
- How to Upload a Video to Instagram Story from PC
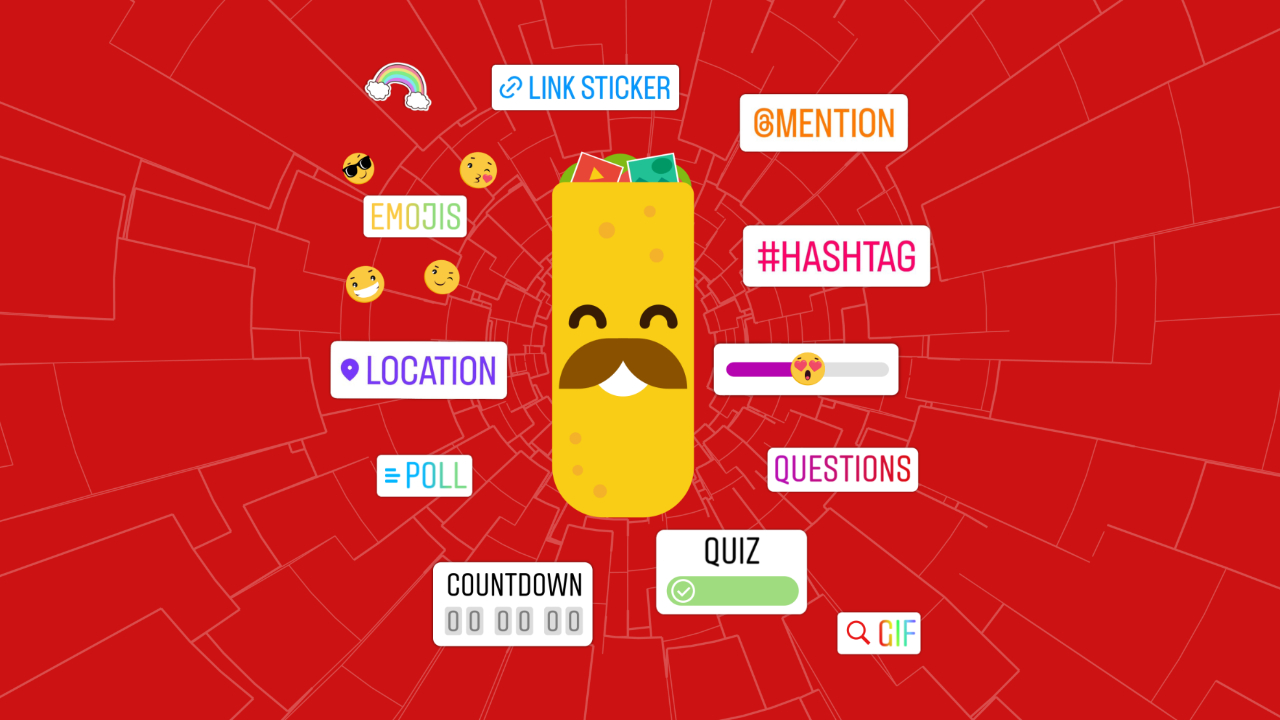
- Schedule Instagram Stories with the Link Sticker
- Upload and post Instagram Reels from PC
- Schedule Instagram Stories
- Can you schedule Instagram stories? Yes, with Storrito.com! (Here's How)
- Instagram Story Planner (Scheduler)
- Schedule Facebook Stories from PC
- Instagram Story Maker Online
- How to schedule Instagram Reels
- How to add a story in Instagram from PC or Mac?
- Post Instagram Stories from PC